
Cryptocurrency Trading 101: A Beginner’s Guide
“Trade crypto with wisdom, sail with strategy. Success in the markets is a journey, not just a destination“
Table of Contents
Introduction to Cryptocurrency Trading
Welcome to the exciting world of cryptocurrency trading! If you’re new to this space, you might find the prospect of trading digital assets a bit overwhelming. Don’t worry – this guide is here to demystify the basics and set you on the path to becoming a confident cryptocurrency trader.
Chapter 1: Understanding Cryptocurrency trading
1.1 What is Cryptocurrency?
Cryptocurrency is a form of digital or virtual currency that employs cryptographic techniques for secure financial transactions. Unlike traditional currencies issued by governments, cryptocurrencies operate on decentralized networks based on blockchain technology, ensuring transparency, security, and immutability.
In the dynamic realm of finance, cryptocurrencies represent a groundbreaking departure from conventional monetary systems. At its core, a cryptocurrency is a decentralized form of currency, utilizing cryptographic principles to secure transactions and control the creation of new units. Let’s delve deeper into the key components that define and distinguish cryptocurrencies:
- Decentralization: Cryptocurrencies operate on decentralized networks, meaning there is no central authority or government control. This decentralization is facilitated by blockchain technology, a distributed ledger that records all transactions across a network of computers.
- Cryptography: The term “cryptocurrency” derives from the use of cryptographic techniques to secure transactions and control the creation of new units. Advanced cryptographic algorithms ensure the integrity and confidentiality of financial transactions in the digital realm.
- Blockchain Technology: Central to the functioning of cryptocurrencies is blockchain technology. This decentralized and tamper-resistant ledger records all transactions in a chronological and transparent manner. Each block in the chain contains a cryptographic link to the previous block, forming a secure and unalterable history of transactions.
- Security and Immutability: Cryptocurrencies prioritize security through cryptographic encryption, making it extremely challenging for unauthorized parties to manipulate transaction data. Additionally, the decentralized nature of blockchain ensures immutability, meaning once a transaction is recorded, it cannot be altered or deleted.
- Digital Nature: Cryptocurrencies exist solely in digital form, with no physical representation like coins or banknotes. They are stored in digital wallets and transacted electronically, providing a seamless and borderless means of exchange.
- Limited Supply: Many cryptocurrencies, including Bitcoin, operate on a fixed supply mechanism. For instance, the total supply of Bitcoin is capped at 21 million coins, introducing an element of scarcity that can influence value over time.
As we navigate the intricacies of cryptocurrency, it’s crucial to recognize the transformative potential of this digital innovation. Beyond serving as a medium of exchange, cryptocurrencies embody principles of decentralization, security, and transparency that challenge and reshape traditional notions of finance. In upcoming blog posts, we’ll continue to explore specific aspects of the cryptocurrency landscape, empowering readers to navigate this exciting frontier with confidence and understanding.
1.2 How Cryptocurrencies Work
Cryptocurrencies operate on a fascinating blend of cutting-edge technology and innovative economic principles. To demystify the mechanics behind these digital assets, let’s explore the fundamental workings of cryptocurrencies:
- Blockchain Technology: At the heart of cryptocurrency operations is blockchain technology. A blockchain is a distributed ledger that chronologically records all transactions across a network. Each block in the chain contains a cryptographic hash of the previous block, creating a secure and transparent history of transactions.
- Cryptographic Security: Cryptocurrencies employ advanced cryptographic techniques to secure transactions and control the creation of new units. Public and private keys are used to facilitate secure and verifiable transactions, ensuring the integrity and confidentiality of financial interactions.
- Transaction Validation: When a user initiates a cryptocurrency transaction, it is broadcasted to the network. Nodes on the network validate the transaction through consensus mechanisms, confirming its legitimacy. Once validated, the transaction is added to a block, and the block is added to the blockchain.
- Mining (for PoW): In Proof of Work (PoW) systems like Bitcoin, miners compete to solve complex mathematical puzzles. The first miner to solve the puzzle gets the opportunity to add a new block to the blockchain and is rewarded with newly created cryptocurrency and transaction fees.
- Staking (for PoS): In Proof of Stake (PoS) systems, validators are chosen to create new blocks based on the amount of cryptocurrency they hold and are willing to “stake” as collateral. Validators are rewarded for creating blocks and verifying transactions.
- Consensus Mechanisms: Different cryptocurrencies employ various consensus mechanisms to ensure agreement on the state of the blockchain. Beyond PoW and PoS, other models like Delegated Proof of Stake (DPoS) and Practical Byzantine Fault Tolerance (PBFT) offer alternative approaches to achieving consensus.
- Digital Wallets: Cryptocurrency users store their digital assets in digital wallets. These wallets are secured with private keys, providing access to the funds. Wallets come in various forms, including software wallets, hardware wallets, and paper wallets.
Chapter 2: Getting Started with Cryptocurrency Trading
2.1.1 Choosing a Cryptocurrency Exchange: A Comprehensive Guide
Selecting the right cryptocurrency exchange is a crucial step for anyone venturing into the world of digital assets. The diverse landscape of exchanges offers various features, security measures, and trading options, making the decision a pivotal one. In this guide, we’ll explore the key factors to consider when choosing a reliable cryptocurrency exchange for trading.
a. Security Measures:
Security should be a top priority when selecting an exchange. Look for platforms that implement robust security measures such as two-factor authentication (2FA), cold storage for the majority of funds, and regular security audits. A trustworthy exchange prioritizes the protection of users’ assets against cyber threats.
b. Reputation and Track Record:
Research the reputation and track record of the exchange. User reviews, testimonials, and historical performance can provide valuable insights into the reliability of the platform. Established exchanges with a proven track record are generally more trustworthy.
c. Regulatory Compliance:
Ensure that the exchange complies with relevant regulations in the jurisdictions it operates. Regulatory compliance adds an extra layer of assurance regarding the exchange’s legitimacy and commitment to following legal standards.
d. Range of Cryptocurrencies Offered:
Consider the variety of cryptocurrencies offered on the exchange. A diverse range of listed assets allows for more trading options and flexibility. However, for beginners, it’s also essential to focus on quality rather than quantity.
e. Liquidity:
Liquidity is a critical factor in determining how easily an asset can be bought or sold without affecting its price. Exchanges with higher liquidity generally offer better trading experiences and more competitive prices.
f. User Interface and Experience:
An intuitive and user-friendly interface contributes significantly to the overall trading experience. Look for exchanges that provide clear charts, easy navigation, and a seamless trading process. A good user experience can enhance your efficiency and reduce the likelihood of errors.
g. Fees and Costs:
Different exchanges have varying fee structures. Consider trading fees, withdrawal fees, and any additional costs associated with using the platform. Some exchanges offer fee discounts for high-volume traders or users holding their native tokens.
h. Customer Support:
Evaluate the quality and responsiveness of customer support. In the fast-paced world of cryptocurrency trading, having access to reliable customer support can make a significant difference, especially during technical issues or account inquiries.
i. Mobile Accessibility:
Check if the exchange provides a mobile application or has a mobile-friendly website. Mobile accessibility is essential for traders who prefer managing their portfolios on the go.
j. Educational Resources:
A reliable exchange often offers educational resources for users. These may include tutorials, guides, and market analysis to help users make informed decisions. Educational support is particularly valuable for beginners.
Choosing the right cryptocurrency exchange requires careful consideration of these factors. By prioritizing security, reputation, and user experience, you can navigate the diverse landscape of exchanges and make an informed decision that aligns with your trading goals and preferences. Stay tuned for more insights into the world of cryptocurrency trading!
2.1.2 Opening an account
Creating an account on a cryptocurrency exchange is a straightforward process, but it’s essential to follow each step carefully to ensure the security of your information. Below is a generalized walkthrough of the typical account creation process for a cryptocurrency exchange:
Step 1: Choose the Exchange
Select a reputable cryptocurrency exchange that aligns with your trading preferences and meets your security standards. Popular exchanges include Crypto.com, Binance, Coinbase, Kraken, CoinSmart and many others.
Step 2: Visit the Exchange Website
Navigate to the official website of the chosen cryptocurrency exchange. Ensure that the website address is correct and starts with “https://” for a secure connection.
Step 3: Sign Up
- Click on the “Sign Up” or “Create Account” button on the homepage of the exchange.
- Fill in the required information:
- Email Address: Provide a valid email address that you have access to.
- Password: Create a strong and unique password. It’s advisable to use a combination of uppercase and lowercase letters, numbers, and special characters.
- Confirm that you agree to the exchange’s terms of service and privacy policy.
Step 4: Email Verification
- After submitting the sign-up form, check your email inbox for a verification message from the exchange.
- Click on the verification link provided in the email to confirm your email address. This step is crucial for security and account activation.
Step 5: Complete Personal Information
- Log in to your newly created account on the exchange’s website.
- Complete your profile by providing necessary personal information. This may include your full name, date of birth, and residential address. Be prepared to upload identification documents for identity verification, as many exchanges comply with Know Your Customer (KYC) regulations.
Step 6: Two-Factor Authentication (2FA)
- Enable two-factor authentication (2FA) for an added layer of security. This usually involves linking your account to a 2FA app like Google Authenticator or receiving authentication codes via SMS.
Step 7: Explore the Platform
- Familiarize yourself with the exchange platform. Navigate through the trading interface, explore available trading pairs, and review any educational resources provided by the exchange.
Congratulations! You’ve successfully created an account on a cryptocurrency exchange. Remember to keep your login credentials, especially your password and 2FA details, secure. Additionally, regularly review and update your security settings to ensure a safe trading experience. Happy trading!
2.2 Funding Your Cryptocurrency Trading Account
Depositing funds into your cryptocurrency trading account is a fundamental step in starting your trading journey. Here’s an overview of common deposit methods and the general process:
Common Deposit Methods:
- Cryptocurrency Deposit:
How it works: Many exchanges allow you to deposit various cryptocurrencies directly into your trading account. You’ll receive a unique deposit address for each cryptocurrency supported by the exchange.
Steps:
a. Log in to your trading account.
b. Navigate to the “Funds,” “Wallet,” or “Deposit” section.
c. Select the cryptocurrency you want to deposit.
d.Copy the provided deposit address.
e.Transfer the desired amount of cryptocurrency to this address from your external wallet or another exchange.
- Bank Transfer:
How it works: You can deposit fiat currency (such as USD, EUR, etc.) directly from your bank account to your exchange account. This method often involves using the exchange’s provided bank details for the transfer.
Steps:
a. Log in to your trading account.
b. Go to the “Funds” or “Deposit” section.
c. Choose the fiat currency you want to deposit.
d. Follow the instructions provided by the exchange to initiate the bank transfer.
e. Include the provided reference or memo information to ensure proper crediting to your account.
- Credit/Debit Card:
How it works: Some exchanges support deposits via credit or debit cards. This method allows for quick funding using your card details.
Steps:
a. Access the “Funds” or “Deposit” section.
b. Select the option for credit/debit card deposits.
c. Enter your card details, including card number, expiration date, CVV, and billing address.
d. Specify the amount you wish to deposit and complete the transaction.
- Electronic Payment Systems:
How it works: Certain exchanges support electronic payment systems like PayPal, Skrill, or Neteller for deposits.
Steps:
a. Visit the “Funds” or “Deposit” section.
b. Choose the electronic payment option.
c. Follow the provided instructions to link your payment account and complete the deposit.
Remember to adhere to security practices and only use trusted and secure payment methods. Additionally, be aware of any fees associated with the chosen deposit method and consider them in your overall trading strategy.
2.3 Basic Cryptocurrency Trading Terms
Demystifying Basic Trading Terms: A Comprehensive Guide for Beginners
Embarking on your journey into the world of cryptocurrency trading can be both exhilarating and intimidating, especially when faced with a myriad of terms and concepts. In this blog post, we’ll unravel the essential trading terms to empower you with the knowledge needed to navigate the markets confidently.
1. Market Order:
A Market Order is a straightforward instruction to buy or sell an asset immediately at the current market price. It guarantees execution but does not guarantee the price, making it a quick and efficient way to enter or exit a position.
2. Limit Order:
On the flip side, a Limit Order allows traders to specify the maximum price they are willing to pay for a buy order or the minimum price they accept for a sell order. This order type provides control over the entry or exit price but does not guarantee execution if the market does not reach the specified price.
3. Stop-Loss Order:
A Stop-Loss Order is a risk management tool that helps mitigate potential losses. It allows traders to set a specific price at which an asset should be sold to limit losses. Once the market reaches the stop-loss price, the order is triggered, helping protect capital in volatile conditions.
4. Take-Profit Order:
Conversely, a Take-Profit Order is a predefined price at which a trader chooses to sell an asset to secure profits. It automates the profit-taking process, ensuring that gains are captured when the market reaches the specified target.
5. Bid and Ask:
Bid represents the highest price a buyer is willing to pay for an asset, while Ask is the lowest price at which a seller is willing to part with the asset. The difference between the bid and ask prices is known as the spread.
6. Liquidity:
Liquidity refers to how easily an asset can be bought or sold in the market without affecting its price significantly. Highly liquid assets have tighter spreads and are generally easier to trade.
7. Bullish and Bearish:
Bullish describes a market sentiment where prices are expected to rise, while Bearish indicates a sentiment anticipating price declines. These terms are often used to characterize trends or market outlook.
8. Volume:
Volume measures the number of shares or contracts traded in a given period. High volume often accompanies strong price movements, indicating increased market interest.
9. Margin Trading:
Margin Trading allows traders to borrow funds to increase their position size. It amplifies both potential gains and losses, requiring careful risk management.
10. Altcoin:
Short for “alternative coins,” Altcoins refer to any cryptocurrency other than Bitcoin. Examples include Ethereum (ETH), Ripple (XRP), and Litecoin (LTC).
11. Wallet:
A Wallet is a digital tool used to store, send, and receive cryptocurrencies. It comes in various forms, including software wallets, hardware wallets, and paper wallets.
12. Fiat Currency:
Fiat Currency is government-issued currency that is not backed by a physical commodity but derives its value from the trust and confidence of the people. Examples include the US Dollar (USD) and Euro (EUR).
Arming yourself with a solid understanding of these basic trading terms lays the foundation for confident and informed decision-making in the dynamic world of cryptocurrency trading. As you delve deeper into the markets, continue expanding your knowledge and refining your strategies to navigate this exciting landscape with skill and precision. Happy trading!
Unveiling the Art of Candlestick Charts: Illuminating Market Dynamics
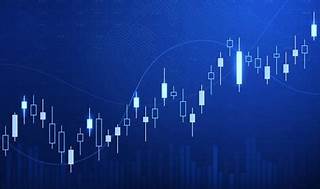
In the realm of financial markets, understanding price movements is a skill that sets successful traders apart. Among the various tools available, candlestick charts stand out as a visually compelling and insightful method for analyzing price action. In this exploration, we’ll illuminate the significance of candlestick charts and how they unveil the intricate dance of market dynamics.
What are Candlestick Charts?
Candlestick charts originated in Japan in the 18th century, developed by rice traders to analyze the price movement of rice contracts. Today, these charts have become a staple in technical analysis across various financial markets, including stocks, forex, and cryptocurrencies.
A candlestick represents a single period of price movement, commonly a day in daily charts. The candle has two main components: the body and the wicks or shadows.
- Body: The rectangular area between the open and close prices. If the close is higher than the open, the body is typically filled or colored, often green or white. If the close is lower, the body is unfilled or colored differently, usually red or black.
- Wicks/Shadows: The thin lines extending above and below the body, representing the high and low prices during the period.
The Significance of Candlestick Charts:
Candlestick charts provide a wealth of information in a visually intuitive format. Here’s why they are significant:
- Price Patterns and Trends:
Candlestick charts vividly illustrate price patterns and trends. Patterns like doji, engulfing, and hammer can signal potential trend reversals or continuations, aiding traders in decision-making. - Market Sentiment:
The color and size of the candlesticks convey market sentiment. A series of green candles suggests bullish momentum, while red candles indicate bearish pressure. The length of the wicks provides insights into market volatility. - Support and Resistance Levels:
Candlestick patterns help identify support and resistance levels. Reversal patterns at these levels can signal potential trend shifts. - Candlestick Patterns:
Various candlestick patterns have specific implications. For instance, a doji signifies market indecision, while a bullish engulfing pattern may signal a potential upward reversal. - Confirmation with Other Indicators:
Traders often use candlestick charts in conjunction with other technical indicators like Moving Averages or Relative Strength Index (RSI) for more robust analysis. - Timeframe Flexibility:
Candlestick charts can be employed across different timeframes, from minutes to months, offering flexibility to traders with various trading preferences.
Mastering the art of reading candlestick charts opens a window into the intricate language of market movements. Traders can decipher not just where prices have been, but also gain insights into potential future directions. Whether you’re a novice or seasoned trader, understanding candlestick charts enhances your ability to make informed decisions in the dynamic world of financial markets. As you embark on your trading journey, let the dance of candlesticks illuminate your path to success. Happy charting!
Chapter 3: Making Your First cryptocurrency Trading move
Chapter 4: Strategies and Analysis in Cryptocurrency trading
4.1 Fundamental vs. Technical Analysis
We will explain the difference between fundamental analysis and technical analysis in cryptocurrency trading, and how to read each of them. I will also provide some examples of how to apply these methods to make better trading decisions.
Fundamental analysis is a technique that evaluates the intrinsic value of a cryptocurrency by looking at various factors that affect its long-term potential, such as its technology, team, community, use cases, tokenomics, partnerships, security, and regulatory environment. The goal of fundamental analysis is to determine whether a cryptocurrency is overvalued, undervalued, or fairly priced in the market, and to identify the best opportunities for long-term investment.
Technical analysis is a technique that analyzes the historical price data and patterns of a cryptocurrency to identify trends and signals that can be used to predict future price movements. The goal of technical analysis is to find optimal entry and exit points for short-term trading, and to optimize trading strategies based on market conditions.
To read fundamental analysis, you need to do extensive research on the cryptocurrency you are interested in, and evaluate its strengths, weaknesses, opportunities, and threats. You can use various sources of information, such as white papers, websites, social media, forums, news articles, podcasts, interviews, reports, etc. You can also use tools such as CoinMarketCap or CoinGecko to check the basic metrics of a cryptocurrency, such as its market capitalization, circulating supply, total supply, volume, etc.
To read technical analysis, you need to use charts and indicators to analyze the price data and patterns of a cryptocurrency. You can use various tools such as TradingView or Coinigy to access charts and indicators. You can also use different types of charts, such as candlestick charts, line charts, bar charts, etc., and different time frames, such as 1 minute, 15 minutes, 1 hour, 4 hours, 1 day, etc. You can also use different types of indicators, such as trend indicators (e.g., moving averages), momentum indicators (e.g., RSI), volatility indicators (e.g., Bollinger Bands), etc.
Here are some examples of how to apply fundamental analysis and technical analysis in crypto trading:
Example 1: You are interested in investing in Bitcoin (BTC) for the long term. You do fundamental analysis on Bitcoin by reading its white paper, checking its website, following its social media accounts, listening to podcasts and interviews with experts and influencers, reading news articles and reports on Bitcoin’s development and adoption, etc. You also check its market capitalization, circulating supply, total supply, volume, etc. You conclude that Bitcoin has a strong value proposition as a decentralized digital currency that is scarce, secure, censorship-resistant, and borderless. You also believe that Bitcoin has a high potential for growth in the future due to its network effects, innovation, adoption rate,
and institutional demand. You decide that Bitcoin is undervalued in the market and that it is a good opportunity for long-term investment.
Example 2: You are interested in trading Ethereum (ETH) for the short term. You do technical analysis on Ethereum by using TradingView to access its chart and indicators. You choose a 4-hour time frame and use candlestick chart type. You also use moving averages (MA), RSI,
and Bollinger Bands as indicators. You observe that Ethereum is in an uptrend as it is trading above its 50-period MA and 200-period MA. You also notice that Ethereum is approaching its upper Bollinger Band and that its RSI is above 70,
indicating that it is overbought. You decide that Ethereum is likely to face resistance at the upper Bollinger Band and that it may reverse or consolidate soon. You decide to sell Ethereum at the upper Bollinger Band and wait for a pullback or a breakout before buying again.
4.2 Reading Price Charts
One of the most important skills for cryptocurrency traders is to be able to read and interpret price charts. Price charts are graphical representations of the historical and current market data, such as the supply and demand, the volume, and the price movements of a particular cryptocurrency. By analyzing price charts, traders can identify trends, patterns, signals, and indicators that can help them make informed decisions about when to buy, sell, or hold a cryptocurrency.
There are different types of price charts that traders can use, depending on their preferences and objectives. Some of the most common ones are:
- Line chart: This is the simplest type of chart that shows the price changes of a cryptocurrency over time by connecting the closing prices of each period (such as an hour, a day, a week, etc.) with a line. A line chart can give a general overview of the price direction and trend, but it does not show any details about the price fluctuations within each period.
- Candlestick chart: This is the most popular type of chart among cryptocurrency traders, as it provides more information and visual cues about the price action within each period. A candlestick chart consists of rectangular bars called “candles” that represent the opening, closing, high, and low prices of each period. The color of the candle indicates whether the price increased or decreased during that period. A green candle means that the closing price was higher than the opening price, while a red candle means that the closing price was lower than the opening price. The thin lines above and below the candles are called “wicks” or “shadows” and they show the highest and lowest prices reached during that period.
- Bar chart: This is similar to a candlestick chart, but instead of using candles, it uses vertical bars to show the opening, closing, high, and low prices of each period. The color of the bar also indicates whether the price increased or decreased during that period. A bar chart can be easier to read than a candlestick chart for some traders, as it does not have any wicks or shadows.
- Heikin-Ashi chart: This is a modified version of a candlestick chart that uses a different formula to calculate the opening, closing, high, and low prices of each period. The result is a smoother chart that filters out some of the noise and shows more clearly the trend direction and strength. A Heikin-Ashi chart can help traders identify trend reversals and continuation patterns more easily than a regular candlestick chart.
To read price charts effectively, traders need to understand some basic concepts and tools that can help them analyze the market data and identify potential trading opportunities. Some of these concepts and tools are:
- Time frame: This refers to the length of each period that is displayed on the chart. For example, a 1-hour chart shows the price changes of a cryptocurrency every hour, while a 1-day chart shows the price changes every day. The choice of time frame depends on the trading style and strategy of each trader. Generally speaking, shorter time frames are more suitable for day traders or scalpers who aim to profit from small price movements in a short period of time. Longer time frames are more suitable for swing traders or investors who aim to profit from larger price movements over a longer period of time.
- Trend: This refers to the general direction and momentum of the price movement over time. A trend can be either upward (bullish), downward (bearish), or sideways (neutral). Traders can use various methods to identify and confirm trends, such as trend lines, moving averages, or trend indicators.
- Support and resistance: These are horizontal levels on the chart that act as barriers for the price movement. Support is a level where the price tends to bounce back up after falling down, while resistance is a level where the price tends to fall back down after rising up. Support and resistance levels can be determined by using previous highs and lows, psychological numbers (such as round numbers or Fibonacci numbers), or technical indicators (such as pivot points or Bollinger bands).
- Pattern: This is a recognizable shape or formation on the chart that indicates a possible future price movement based on past behavior. Patterns can be either reversal patterns (such as head and shoulders, double tops or bottoms, wedges, etc.) or continuation patterns (such as flags, pennants, triangles, etc.). Traders can use patterns to anticipate potential breakouts or breakdowns in the price direction.
- Signal: This is an event or condition on the chart that suggests a possible trading opportunity based on certain criteria or rules. Signals can be generated by using technical indicators (such as moving average crossovers, MACD divergences, RSI oversold or overbought conditions, etc.), candlestick patterns (such as hammer, doji, engulfing, etc.), or volume analysis (such as spikes in buying or selling pressure).
Reading price charts is an essential skill for cryptocurrency traders who want to succeed in this volatile and dynamic market. By using different types of charts, concepts, and tools, traders can gain a deeper understanding of the market behavior and psychology, and make more informed and profitable trading decisions.
Chapter 5: Security and Best Practices
5.1 Securing Your Investments
5.2 Continuous Learning